————————————————————————————————
Monthly Discussion
The Evolution of the EU
If the European Union is to ever achieve a state of nationhood, it must follow a natural growth process. The hallmark of a natural growth process is the S-shaped pattern I have amply describe in Predictions. But this smooth pattern that growth in competition theoretically follows, is often distorted in real life. Typical distortions are shown in Exhibit 3.
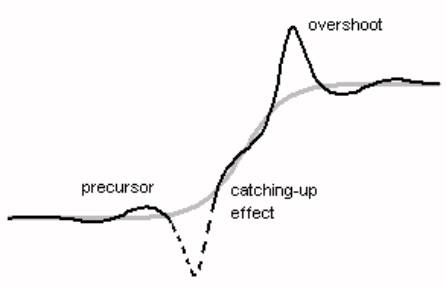
Exhibit 3.
The natural growth pattern often shows deviations from the S-shaped
pattern such as precursors, overshoots and catching-up effects, see Predictions.
The origin and real-life equivalent of
these deviations are rather evident. Precursors are unsuccessful early
attempts, often considered as failures. The quite period that follows a
precursor contributes to “pent-up demand” and results into a period of rapid
growth (catching-up effect). Finally, a well-established growth process may overshoot
and later fall back and settle at a lower level.
We may expect these phenomena in the
growth process of the European Union. In Exhibit 4 I graph all events related
in the construction of the EU, as reported in http://europa.eu.int/abc/history/index_en.htm published by
the European Union. The chronology includes all kinds of events, important
ones, like the introduction of the unique currency, as well as less important
ones, like the change of the presidency from one country to another. By putting
all events together in one data set we are defining an “index of activity”
relating to the formation of the EU. This index has been growing since
September 19, 1946 when Winston Churchill first called for a “kind of United
States of Europe”. The growth has been steady and turbulent accelerating
sometimes, decelerating at other times. But for obvious reasons, when maturity
is eventually achieved, this index must stabilize.
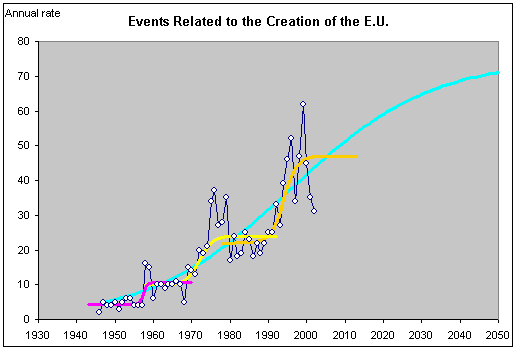
Exhibit 4. The number of events directly contributing
to the creation of the EU has followed an overall S-shaped pattern, while going
through smaller S-shaped patterns.
As in all sustained growth, the
evolution of the number of events that has shaped the EU has followed
successive steps. Each step, itself an S-curve, displays the deviations
expected in Exhibit 3. In addition, an overall S-curve of large time frame
(turquoise line) indicates that the growth process was 82.4% complete on March
1, 2003. One or two more small steps should be expected.
The consequences of Exhibit 4 are far
reaching, however, because can help us form a realistic estimate of EU’s final
size. There have been proposals and discussions that could extend EU’s borders
deep into Asia (e.g., with Turkey’s candidature), and even reach the Pacific
Ocean with Russia’s possible eventual inclusion. How much of his is realistic
in view of EU’s recent failure to present a united policy on the war with Iraq?
Voices have been occasionally raised for a 2-speed EU with a few “hard core”
states and many more “satellite” states.
Only 12 European countries have joined so far in all
respects, including monetary union. If 12 corresponds to 82.4% of the final
number, one estimate for this final number is 14 to 15, a number far below the
26 presently worked on. In this light talk about Turkey’s and Russia’s
admission to the EU sounds absolutely far-fetched.